
Index Funds vs. Actively Managed Funds

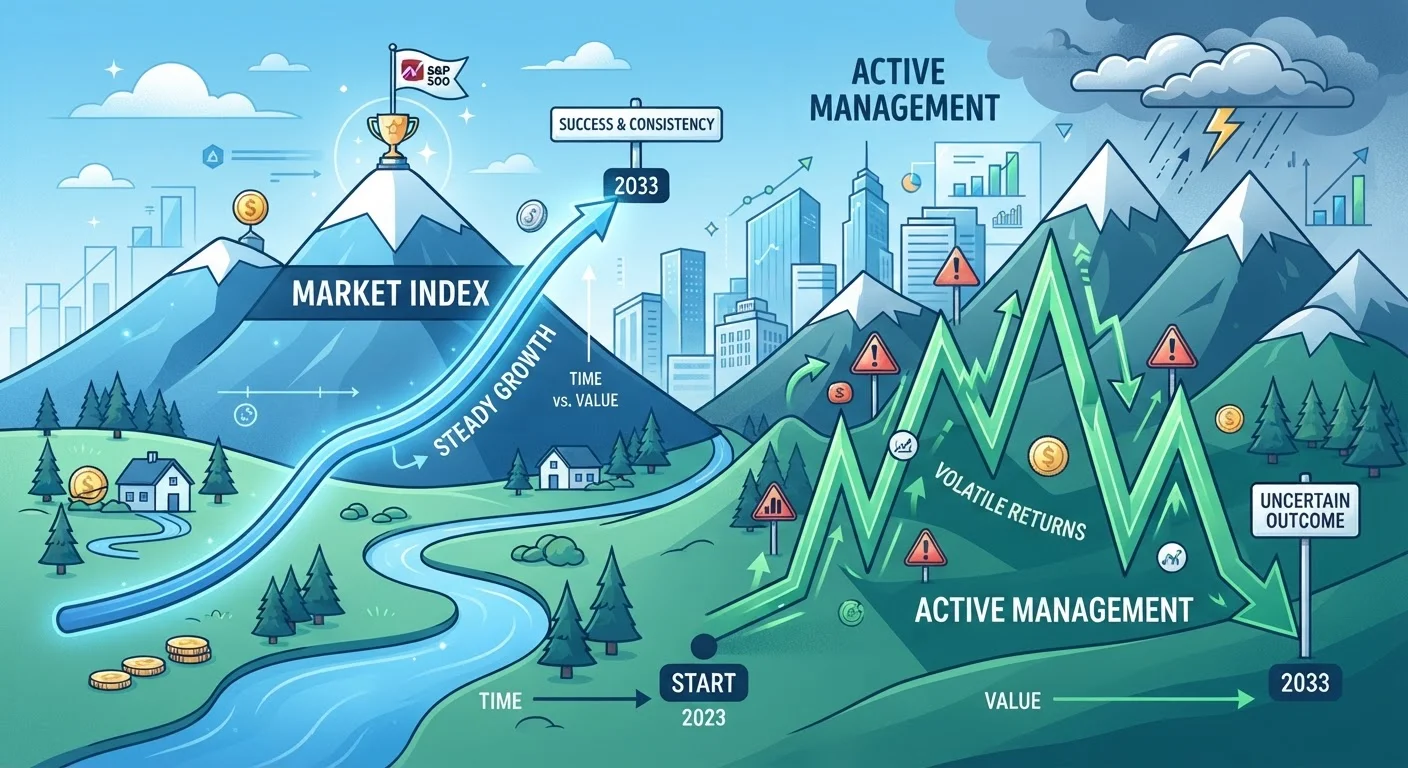
Photo: AdvisorBooth.net editorial
Key Takeaways
- Index funds passively track a market index like the S&P 500, keeping costs very low.
- Actively managed funds employ professional managers who select securities in an attempt to outperform the market.
- Research consistently shows most actively managed funds underperform their benchmark index over long periods.
- Expense ratios for index funds are typically far lower than those for actively managed funds.
- Neither approach eliminates investment risk - all funds can lose value.
- Your time horizon, risk tolerance, and goals should guide which approach fits your situation.
How Each Approach Works
Understanding the difference starts with a simple question: should your fund try to match the market or beat it?
Index funds are designed to replicate the performance of a specific market index - such as the S&P 500, which tracks 500 large U.S. companies. The fund holds the same securities in roughly the same proportions as the index. There's no team of analysts making buy-or-sell calls; the portfolio adjusts only when the index itself changes. This passive structure keeps operating costs low and trading activity minimal.
Actively managed funds work differently. A portfolio manager - or a team of managers - conducts research, analyzes company financials, and makes deliberate decisions about which securities to hold, when to buy, and when to sell. The explicit goal is to outperform a benchmark index. This ongoing human effort introduces higher operating costs, which are passed along to investors as higher fees.
If you're still building your foundational vocabulary, our investing glossary for beginners defines terms like expense ratio, benchmark, and diversification in plain language.
| Criterion | Index Funds | Actively Managed Funds |
|---|---|---|
| Management style | Passive - tracks an index | Active - manager selects securities |
| Typical expense ratio | Under 0.20% annually | 0.50%-1.00%+ annually |
| Goal | Match market returns | Beat market returns |
| Trading frequency | Low - changes only with the index | High - ongoing buy/sell decisions |
| Tax efficiency | Generally higher | Generally lower |
| Long-term track record | Majority outperform active peers | Most underperform index benchmarks |
| Transparency | Highly predictable holdings | Holdings shift frequently |
What the Evidence Shows on Performance
The central promise of active management is market-beating returns. But decades of data complicate that promise considerably.
S&P Global's SPIVA (S&P Indices Versus Active) research, which tracks fund performance against benchmarks across multiple time periods, has consistently found that the majority of actively managed funds underperform their benchmark index over periods of 10 to 20 years. Importantly, this pattern holds across most asset categories and geographies, not just U.S. large-cap equities.
~85%
Active large-cap funds underperforming S&P 500
According to S&P Global's SPIVA U.S. Scorecard, roughly 85% of active large-cap U.S. equity funds underperformed the S&P 500 over a 15-year period.
0.05%-0.10%
Typical index fund expense ratio range
Many broad-market index funds carry annual expense ratios in this range, compared to significantly higher fees common among actively managed funds.
~$30,000+
Estimated cost difference over 30 years
On a $100,000 investment, a 0.75% annual fee difference can amount to tens of thousands of dollars in lost compounding over a 30-year horizon, based on standard compound-growth modeling.
A key reason is cost. Even when an active manager generates above-average gross returns, the higher expense ratio erodes the advantage - often eliminating it entirely. Over decades, a seemingly small annual cost difference of 0.75% can compound into a substantial reduction in total portfolio value.
This doesn't mean every active fund underperforms every index fund. Some managers do outperform their benchmarks, sometimes by a meaningful margin. The challenge for investors is identifying in advance which managers will outperform - a task that research suggests is extremely difficult, partly because past outperformance is not reliably predictive of future results.
Costs, Taxes, and Practical Differences
Beyond headline performance, several practical factors distinguish the two approaches.
Expense ratios: Index funds often carry annual fees below 0.10%-0.20%. Actively managed funds commonly charge 0.50%-1.00% or more. Over a 30-year investment horizon, this difference can meaningfully affect final portfolio value.
Tax efficiency: Because index funds trade infrequently, they tend to generate fewer taxable capital gains distributions compared to actively managed funds, which buy and sell more regularly. This matters most in taxable (non-retirement) accounts.
Transparency: Index fund holdings are predictable by design - you know approximately what you own. Active fund holdings can shift frequently, making it harder to assess the portfolio at any given moment.
Availability and minimums: Both fund types are widely accessible through brokerage accounts and retirement plans such as 401(k)s and IRAs. Minimum investment requirements vary by fund and platform.
For context on how these funds fit within a broader portfolio, see our guide to stocks, bonds, and cash as asset classes. And if you're thinking about how your investment timeline affects these choices, our article on short-term vs. long-term investing offers useful framing.
A Note on Risk for Both Fund Types
This article is for general informational and educational purposes only and does not constitute personalized investment advice. All investing involves risk, including the possible loss of principal. Consult a qualified financial adviser before making decisions based on your individual circumstances.
The content on this site is for informational purposes only and is not a substitute for professional advice. Always consult a qualified professional for guidance specific to your situation.