
Supply, Demand, and Interest Rates: The Forces Behind Home Price Swings

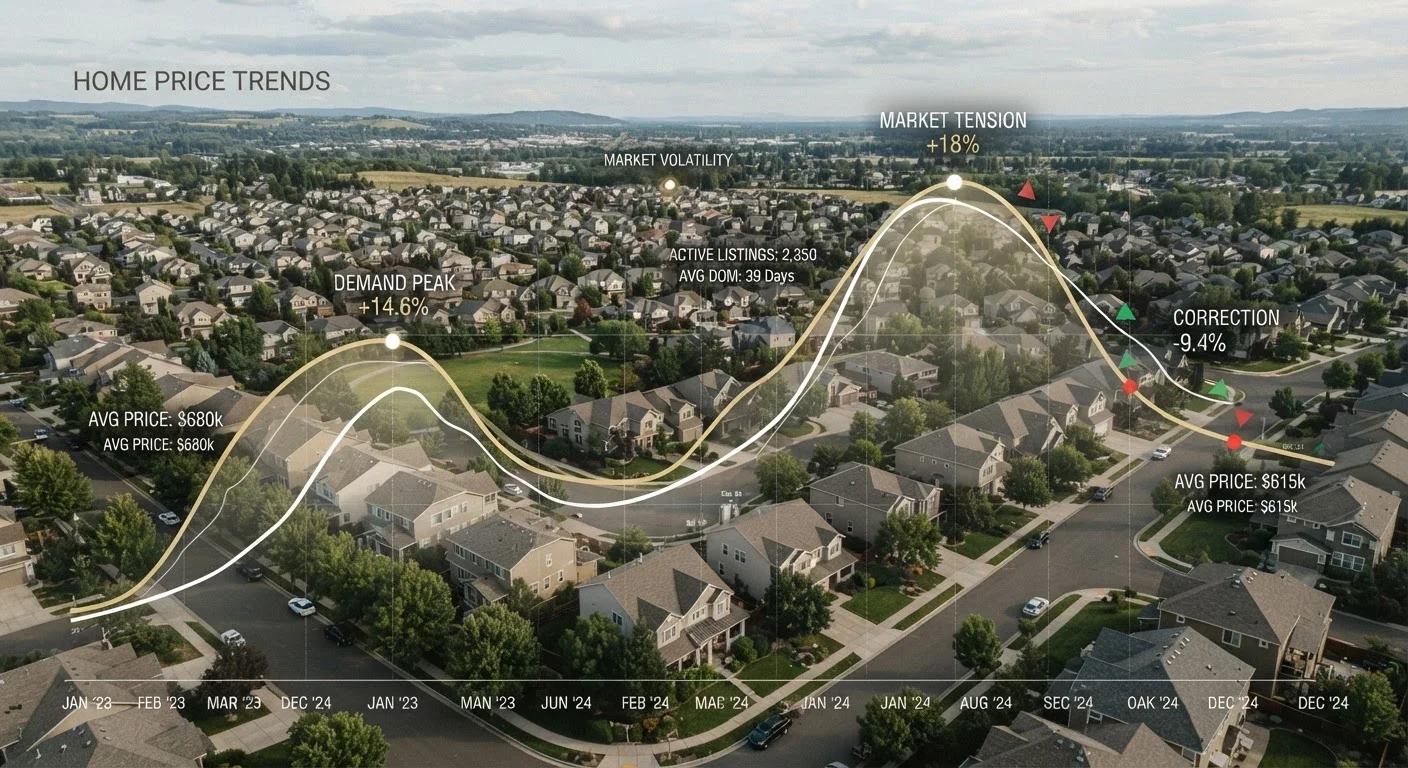
Photo: AdvisorBooth.net editorial
Key Takeaways
- Housing supply and buyer demand are the primary engines of home price movement.
- Interest rates directly affect how much home a buyer can afford, influencing demand.
- Local factors - job growth, zoning laws, new construction - can override national trends.
- Inventory levels (months of supply) are one of the clearest signals of price pressure.
- No single indicator tells the whole story; price trends reflect multiple overlapping forces.
The Basic Mechanics: Supply Meets Demand
At its core, a home's market price reflects what a willing buyer and a willing seller agree on - but that agreement doesn't happen in a vacuum. It's shaped by how many homes are for sale relative to how many buyers are actively looking. This balance, often measured as months of supply (the time it would take to sell all current listings at today's sales pace), is one of the most reliable early signals of price direction.
When inventory is thin - say, two or three months of supply - buyers compete for the same homes, driving prices upward. When listings accumulate past five or six months of supply, sellers face more competition and typically accept lower offers. Understanding this dynamic is the starting point for interpreting any price data you encounter.
For a broader grounding in how homes get priced from the start, see this introduction to home valuation.
~4 months
Supply level that signals a balanced housing market
The National Association of Realtors has historically characterized four to six months of inventory as a balanced market between buyers and sellers.
~1 percentage point
Rate increase that can reduce buyer purchasing power by roughly 10%
Industry analysts generally estimate that each 1-point rise in mortgage rates reduces a buyer's affordable loan amount by approximately 10%, though the exact figure varies by income and loan size.
3.8 million
Estimated U.S. housing unit shortfall
A 2021 analysis by the National Association of Realtors estimated the United States faced a shortage of approximately 3.8 million housing units, a structural supply gap that underlies persistent price pressure.
How Interest Rates Reshape Buyer Demand
Mortgage interest rates act as a volume dial on buyer demand. When rates fall, monthly payments drop, and more households can qualify for a loan at a given price point - expanding the pool of active buyers. When rates rise, that pool contracts. A buyer who could afford a $400,000 home at a 4% rate might only qualify for $340,000 at 7%, assuming the same income and down payment.
This is why national monetary policy decisions ripple into neighborhood-level real estate markets. Rate increases don't always cause prices to fall outright, but they typically slow appreciation and extend time-on-market. In supply-constrained markets, prices may simply flatten rather than decline, because sellers aren't forced to accept lower offers - they can wait.
How you finance a purchase also interacts with rate volatility. Fixed-rate and adjustable-rate mortgages carry different risk profiles depending on where rates are headed - worth understanding before committing.
“Interest rates are the price of money, and housing prices are heavily influenced by the price of money. When money is cheap, home prices tend to rise; when money is expensive, the market cools.”
— Lawrence Yun, Chief Economist, National Association of Realtors
Local Forces That National Headlines Miss
National price data - median sale prices, year-over-year indexes - can obscure what's actually happening in your target market. A metro area posting average price growth may contain ZIP codes falling sharply and others rising quickly, driven by purely local conditions.
Key local drivers include:
- Job market concentration: A single large employer expanding or contracting can swing local demand significantly.
- Zoning and permitting constraints: Cities with restrictive land-use rules can't easily build more housing, so any demand increase hits prices hard.
- New construction pipeline: A surge of new units coming to market can cap or reduce prices in nearby neighborhoods.
- Migration patterns: Remote work has shifted demand toward lower-cost metros, creating price spikes in places that historically saw stable, modest growth.
These factors explain why two cities in the same state can have radically different price trajectories in the same year. Beyond these structural forces, neighborhood-level attributes - schools, walkability, proximity to development - layer on additional value signals, as explored in this look at neighborhood factors that shape home worth.
Reading Market Conditions as a Buyer or Seller
Knowing which forces are active in a market helps you interpret listing prices more accurately and set realistic expectations. A home priced aggressively in a low-inventory market isn't overvalued in the same way it would be in a market with rising supply. Context is everything.
The concept of a seller's market versus a buyer's market captures this shift in negotiating power. In a seller's market, demand exceeds supply, offers come in above asking, and contingencies get waived. In a buyer's market, listings sit longer, sellers make concessions, and inspection issues carry real negotiating weight. Understanding how each market type affects valuation can sharpen how you read any price you see.
For those who want to track these conditions over time without being misled by seasonal swings or median price distortions, accurate methods for following local home value trends offer a more reliable framework than headline numbers alone.
This article is for informational and educational purposes only and does not constitute financial, investment, or legal advice. Consult a qualified real estate professional or financial adviser before making property-related decisions.
Frequently Asked Questions
The content on this site is for informational purposes only and is not a substitute for professional advice. Always consult a qualified professional for guidance specific to your situation.